GCSE Tutoring Programme
"Our chosen students improved 1.19 of a grade on average - 0.45 more than those who didn't have the tutoring."
In order to access this I need to be confident with:
Fractions, decimals and percentages Multiplying decimals Fractions of amounts Percentage of an amount Dividing ratios Forming and solving equationsThis topic is relevant for:

Probability Distribution
Here we will learn about probability distribution, including theoretical probability, sample space, relative frequency, experimental probability and expected frequency.
There are also probability distribution worksheets based on Edexcel, AQA and OCR exam questions, along with further guidance on where to go next if you’re still stuck.
What is a probability distribution?
A probability distribution is a summary of the probabilities of all possible outcomes of an experiment or situation, known as a random variable.
In GCSE mathematics they are usually described using a table.
For example,
This table shows the theoretical probability distribution for a fair 5 -sided spinner.

As the spinner is fair, the probability of landing on each value should be the same.
Step-by-step guide: Theoretical probability
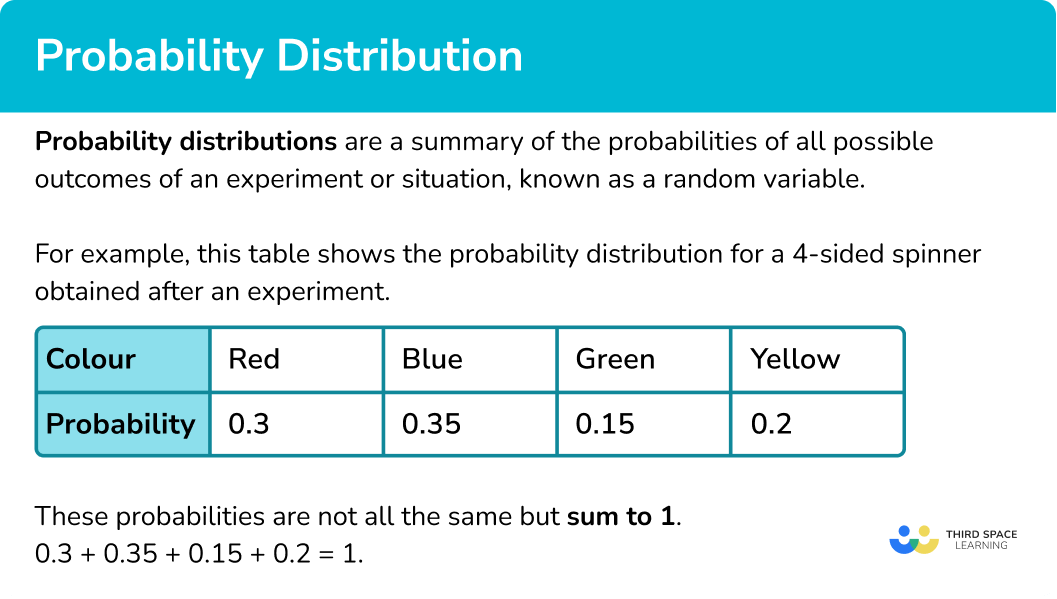
This table shows the probability distribution for a 4 -sided spinner obtained after an experiment.

These probabilities are not all the same but still sum to 1.
0.3 + 0.35 + 0.15 + 0.2 = 1.Step-by-step guide: Experimental probability
In a GCSE mathematics question, you may need to complete probability distribution tables or use the probabilities to solve problems and make predictions.
You are often asked to estimate the number of times a certain event will happen out of a given number of trials. This is known as expected frequency and can be worked out using this formula.
\text{Expected frequency = Probability of event }\times \text{ number of trials}Step-by-step guide: Expected frequency
See also: Relative frequency
What is a probability distribution?

How to use probability distribution
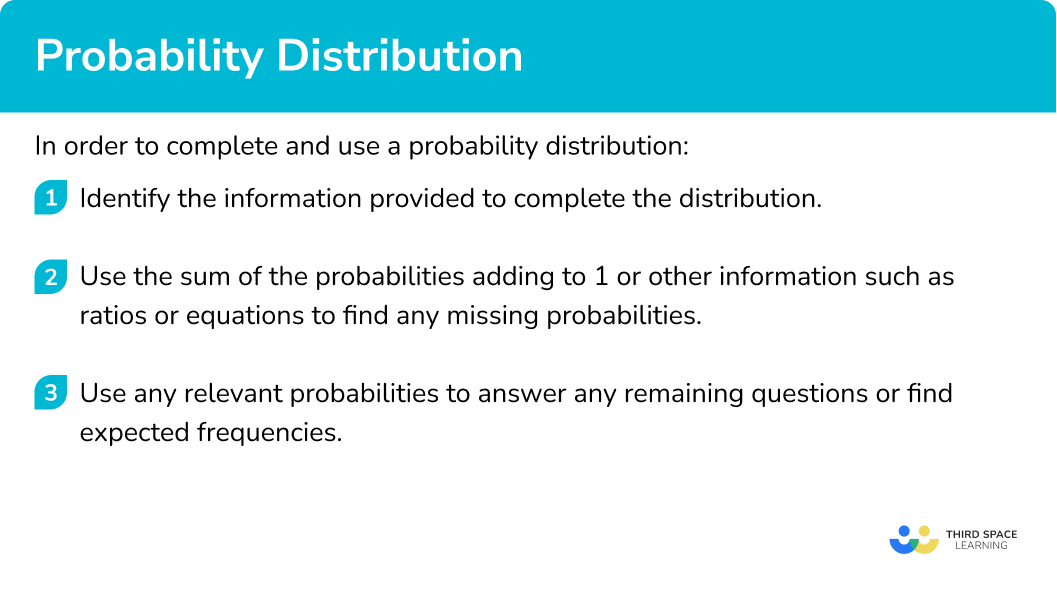
In order to complete and use probability distribution:
- Identify the information provided to complete the distribution.
- Use the sum of the probabilities adding to \bf{1} or other information such as ratios or equations to find any missing probabilities.
- Use any relevant probabilities to answer any remaining questions or find expected frequencies.
Explain how to use probability distribution


Probability distribution worksheet

Get your free probability distribution worksheet of 20+ questions and answers. Includes reasoning and applied questions.
DOWNLOAD FREE
Probability distribution worksheet

Get your free probability distribution worksheet of 20+ questions and answers. Includes reasoning and applied questions.
DOWNLOAD FREEProbability distribution examples
Example 1: completing a probability distribution
A 3 -sided spinner can land on blue, green or red.
The table shows the probabilities for the spinner landing on blue and green. Find the probability of the spinner landing on red.

- Identify the information provided to complete the distribution.
You have been given the probabilities of the spinner landing on blue and green, there is only the probability of the spinner landing on red missing.
2Use the sum of the probabilities adding to \bf{1} or other information such as ratios or equations to find any missing probabilities.
P(red) = 1-0.4-0.05 = 0.55
3Use any relevant probabilities to answer any remaining questions or find expected frequencies.
No other information is required.
P(red) = 0.55
Example 2: completing a probability distribution with more than one missing value
A bag only contains white, red and black counters. The probability of selecting a black counter is 0.3. It is known that there are the same number of white counters as red counters.
Produce a table showing the probability distribution for the counters and find the expected frequency of red counters if there are known to be 60 counters in total in the bag.
Identify the information provided to complete the distribution.
You have been given the probability of selecting a black counter and if the number of white counters is the same as the number of red counters, their probabilities will be the same.
Use the sum of the probabilities adding to \bf{1} or other information such as ratios or equations to find any missing probabilities.
P(white or red) = 1-0.3 = 0.7.
P(white) = P(red), therefore each must be 0.35.
This gives us the probability distribution for the counters.

Use any relevant probabilities to answer any remaining questions or find expected frequencies.
If there are 60 counters in the bag, use the formula,
\text{Expected frequency = Probability of event }\times \text{ number of trials} .
Number of red counters 0.35\times 60=21.
Example 3: completing a probability distribution using a ratio or equation
A 4 -sided spinner can land on blue, green, red or yellow.
The table shows the probabilities for the spinner landing on blue and green. The probability of the spinner landing on red is twice the probability of it landing on yellow.
Find the probability of the spinner landing on red or green.

Identify the information provided to complete the distribution.
You have been given the probabilities of the spinner landing on blue and green.
You also know P(red):P(yellow) = 2:1.
Use the sum of the probabilities adding to \bf{1} or other information such as ratios or equations to find any missing probabilities.
P(red or yellow) = 1-0.25-0.39 = 0.36
Share 0.36 in the ratio 2:1.
0.36\div 3=0.12
This gives P(red) = 0.24 and P(yellow) = 0.12.
You could have also formed an equation.
Let P(red) = 2x and P(yellow) = x.
\begin{aligned}
2x+x&=0.36\\\\
3x&=0.36\\\\
x&=0.12
\end{aligned}
Use any relevant probabilities to answer any remaining questions or find expected frequencies.
You can use the completed probability distribution.

P(red or green) = P(red) + P(green) = 0.24 + 0.39 = 0.63.
Common misconceptions
- Assuming that all probabilities are the same
It is possible for students to assume that all the probabilities in a distribution will be the same.
- Not knowing the meaning of the words “and“ and “or” in probability questions
It is important that students understand the difference between “and” and “or” and when they need to multiply probabilities and when they should add probabilities. In GCSE mathematics questions, the word “or” will mean they need to add the probabilities. “And” will involve multiplication.
Practice probability distribution questions
1. A bag contains only red, blue and green counters. Find the missing probability in this probability distribution.


2. A 3 -sided spinner is numbered 1, 2 and 3.
The probability of it landing on a 2 is 0.44. The probability of it landing on a 1 is the same as landing on a 3.
Find the probability of the spinner landing on a 1.


3. A bag contains only blue, yellow and green counters.
The probability of selecting a blue counter is \frac{2}{5}
The number of yellow counters is 3 times the number of green counters.
Which is the correct probability distribution for the counters in the bag?


Share \frac{3}{5} in the ratio 3:1.
4. A biased dice can land on a 1, 2, 3, 4, 5 or 6.
The table shows the probabilities of it landing on a 1, 2 or 3.
![]()
The probabilities of it landing on a 4, 5 or 6 are in the ratio 2:3:5. Which is the correct probability distribution for the die?
![]()

![]()

![]()

![]()

1-0.35 = 0.65. Share 0.65 in the ratio 2:3:5.
\begin{aligned} &0.65\div (2+3+5)=0.65\div 10=0.065 \\\\ &2\times 0.065=0.13 \\\\ &3\times 0.065=0.195 \\\\ &5\times 0.065=0.325 \end{aligned}
5. The table shows the probability distribution for a 3 -sided spinner.

Find the value of x.


Form an equation and solve.
\begin{aligned} 4x+0.1&=1\\\\ 4x&=0.9\\\\ x&=0.225 \end{aligned}
6. A 4 -sided spinner can land on blue, red, green or white.
The probabilities of landing on blue or green are shown in the table.
![]()
The spinner landing on white is twice as likely as it landing on red.
If the spinner is spun 300 times, how many times would it be expected to land on white?


P(white) = 0.38
0.38\times 300=114
Probability distribution GCSE questions
1. A bag contains only white, yellow and red counters. There are twice as many red counters as yellow counters and three times as many yellow counters as white counters.
A counter is selected at random.
Fill in the table to show the probability distribution for the bag of counters.

(4 marks)
Process of forming a ratio or equation linking amounts of white, yellow and red counters. For example,
W:Y:R = 1:3:6 or equivalent.
(1)
P(white) = 0.1 or equivalent.
(1)
P(yellow) = 0.3 or equivalent.
(1)
P(red) = 0.6 or equivalent.
(1)

2. A spinning arrow can land on the numbers 1, 2, 5, and 7.
The probabilities of the arrow landing on 1 or 5 are shown in the table.

The arrow is half as likely to land on 2 as it is 7.
(a) Complete the missing probabilities in the table.
(b) The arrow is spun 200 times. How many times would we expect it to land on 1?
(5 marks)
(a)
Finding P( 2 or 7 ) =1-0.3-0.4 = 0.3.
(1)
Attempt to share 0.3 in the ratio 1:2 or form an equation.
(1)
0.1 and 0.2 shown.
(1)
(b)
Attempt to multiply 0.3 by 200 .
(1)
60(1)
3. The table shows the probability of winning cash prizes from an arcade game.
![]()
It costs 20p to play the game. Abbie plays the game 300 times.
Calculate the profit or loss that Abby will make, stating clearly whether it is a profit or loss.
(5 marks)
Finding expenditure of 6000 pence or £60.
20 \times 300=6000(1)
Finding expected frequency of one of the amounts.
\begin{aligned} \\ &0.5 \times 300=150 \\\\ &0.3 \times 300=90 \\\\ &0.15 \times 300=45 \\\\ &0.05 \times 300=15 \end{aligned}(1)
Finding one of the winnings.
10p – 10\times 90=900
900 pence or £9 .
50p – 50\times 45=2250
2250 pence or £22.50 .
£1 – 1 \times 15=15
£15 or 1500 pence.
(1)
Finding sum of winnings.
9+22.50+15=46.50£46.50 or 4650 pence
(1)
Stating “loss” and £13.50 or 1350 pence.
60-46.50=13.50(1)
Learning checklist
You have now learned how to:
- Understand probability distributions
- Use a probability model to predict the outcomes of future experiments
The next lessons are
Still stuck?
Prepare your KS4 students for maths GCSEs success with Third Space Learning. Weekly online one to one GCSE maths revision lessons delivered by expert maths tutors.

Find out more about our GCSE maths tuition programme.