FREE DOWNLOAD
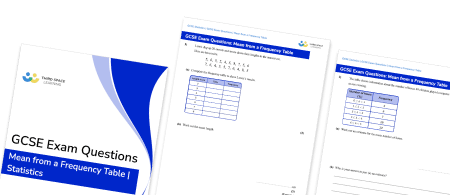
Averages From Frequency Table Worksheet

Help your students prepare for their Maths GCSE with this free averages from frequency table worksheet of 24 questions and answers
- Section 1 of the averages from frequency table worksheet contains 18 skills-based averages from frequency table questions, in 3 groups to support differentiation
- Section 2 contains 3 applied averages from frequency table questions with a mix of worded problems and deeper problem solving questions
- Section 3 contains 3 foundation and higher level GCSE exam style questions on averages from a frequency table
- Answers and a mark scheme for all averages from frequency table questions are provided
- Questions follow variation theory with plenty of opportunities for students to work independently at their own level
- All questions created by fully qualified expert secondary maths teachers
- Suitable for GCSE maths revision for AQA, OCR and Edexcel exam boards
Unlock access to download your free resource
You can unsubscribe at any time (each email we send will contain an easy way to unsubscribe). To find out more about how we use your data, see our privacy policy.
Averages from frequency table at a glance
Given a table of data, we can find the mean, median, mode and range of the data set. For example, this table shows the number of goals scored in 21 football matches:
Number of Goals Frequency
0 5
1 4
2 7
3 4
- The mode is the most common number of goals scored. The number of goals with the highest frequency is 2 and so the mode = 2.
- The median is the middle value. In this case it is the 11th value, which would be 2.
- To find the mean number of goals, we multiply the number of goals by their frequency, add these totals (30) and divide by the total number of games (21). The mean is therefore 1.4.
- The range is the difference between the highest and lowest number of goals. 3 subtract 0 is equal to 3.
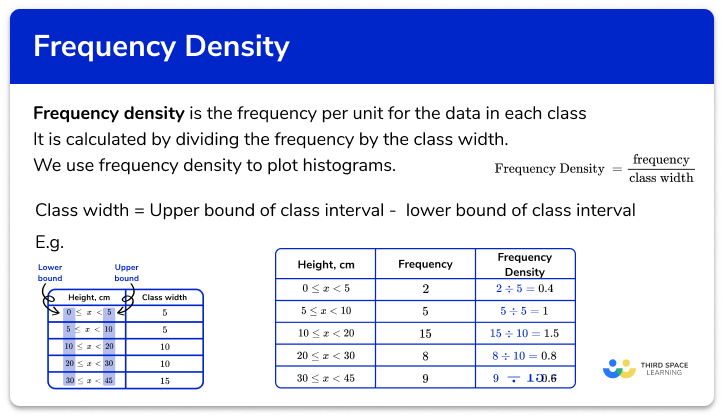
We can also find averages from a grouped frequency table, where data is arranged into groups. The class intervals for grouped data are often denoted using inequalities. For example, the classes of data about the shoe size, s, of a number of people could be 1≤s<4, 4≤s<7, and 7≤s<10.
For grouped data:
- The modal class is the class with the highest frequency.
- The class which contains the median which is the class in which the middle value lies.
- To find the estimated mean, we multiply the midpoint of each class by its frequency, add these together and divide by the total number of items included in the table.
You may be asked to find missing numbers in a frequency table using averages.
Looking forward, students can then progress to additional Statistics worksheets, for example a mean, median, mode and range worksheet or pie chart worksheet.

For more teaching and learning support on Statistics our GCSE maths lessons provide step by step support for all GCSE maths concepts.
Do you have GCSE students who need additional support?
There will be students in your class who require individual attention to help them achieve their target GCSE maths grade. In a class of 30, it’s not always easy to provide.
Help your students feel confident with exam-style questions and the strategies they’ll need to answer them correctly with personalised online one to one tutoring from Third Space Learning
Lessons are selected to provide support where each student needs it most, and specially-trained GCSE maths tutors adapt the pitch and pace of each lesson. This ensures a personalised revision programme that raises grades and boosts confidence.

