GCSE Tutoring Programme
"Our chosen students improved 1.19 of a grade on average - 0.45 more than those who didn't have the tutoring."
This topic is relevant for:

Types Of Data
Here we will learn about types of data, including primary data, secondary data, qualitative data, quantitative data, discrete data and continuous data.
There is also a types of data worksheet based on Edexcel, AQA and OCR exam questions, along with further guidance on where to go next if you’re still stuck.
What are types of data?
Types of data are collected and used for research purposes.
They can be used to find information about the population of a town or country, or used by a business to plan advertising campaigns or used to make predictions about the future.
We need to understand the different kinds of data that can be collected and the different statistical ways it can be analysed or interpreted.
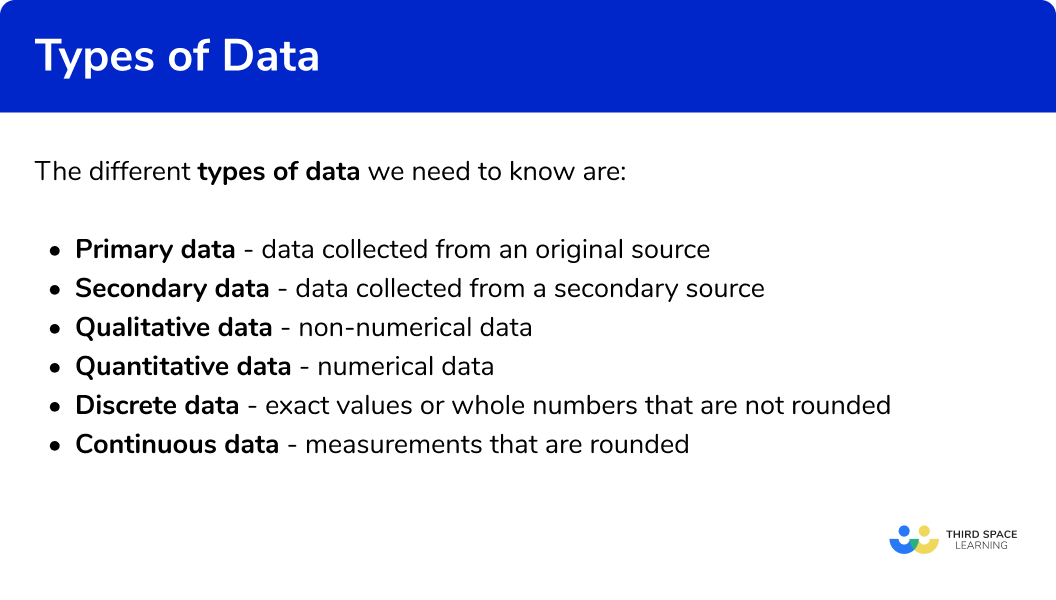
The different types of data we need to know are:
- Primary data – data collected from an original source
- Secondary data – data collected from a secondary source
- Qualitative data – non-numerical data
- Quantitative data – numerical data
- Discrete data – exact values or whole numbers that are not rounded
- Continuous data – measurements that are rounded
Quantitative data is the type of data which we will mostly deal with in GCSE mathematics. The different types of quantitative data have different kinds of statistical processes that can be applied, such as averages, bar charts, pie charts, frequency tables, cumulative frequency diagrams and histograms.
Quantitative data is looked at in more depth in A level mathematics and statistics
What are types of data?

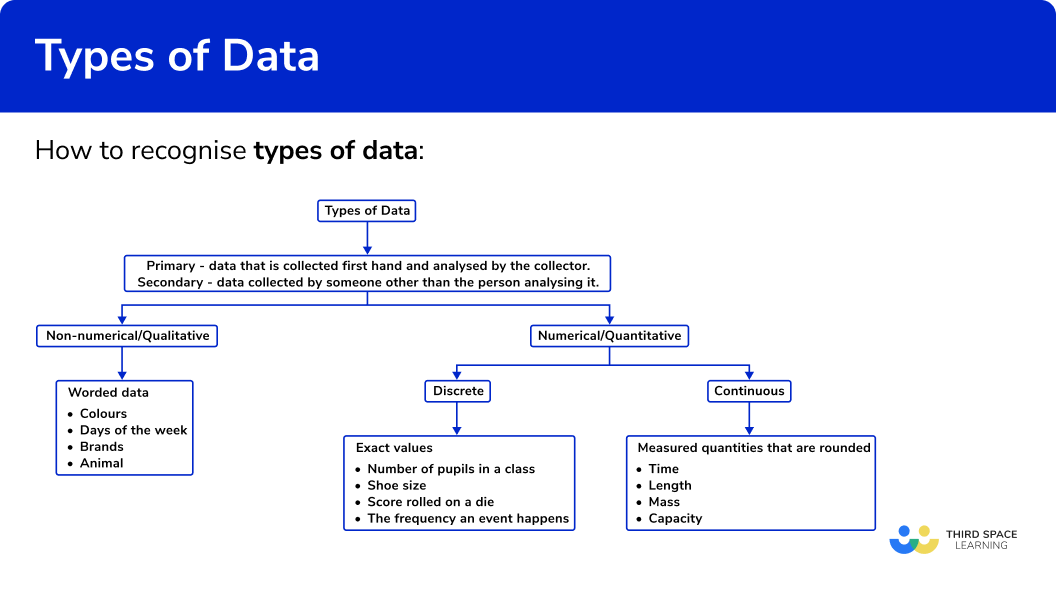
How to recognise types of data


Types of data worksheet

Get your free types of data worksheet of 20+ questions and answers. Includes reasoning and applied questions.
DOWNLOAD FREE
Types of data worksheet

Get your free types of data worksheet of 20+ questions and answers. Includes reasoning and applied questions.
DOWNLOAD FREETypes of data examples
Example 1: recognising types of data
Charlie does a survey in her class on favourite fizzy drinks.
Write two words that describe the type of data she is collecting.
- Looking at the flowchart…
- Charlie is collecting primary, qualitative data.
Example 2: recognising types of data
Daniel was researching the winning times of the 100 metre sprint for the last 10 Olympic games. Write three words that describe the type of data Daniel will be collecting.
- Looking at the flowchart…
- Daniel is collecting secondary, quantitative, continuous data.
Example 3: recognising types of data
The bar chart shows the results from 40 rolls of a die performed by a student in a maths lesson.
Write down three words that describe the data in the bar chart.
- Looking at the flowchart…
- The bar chart is showing primary, quantitative, discrete data.
Common misconceptions
- Mixing up data types
It is very easy to mix up the different types of date, use the flow diagram to help to distinguish between them.
- Shoe size
Even though a person’s shoe size is based on the length of their foot, the size allocated to that person can only be a certain value such as 6 or 6.5 in UK sizings.
Therefore, shoe size is an exact value which makes it discrete data. If the size of the shoe was given as Small, Medium or Large, it would be classified as qualitative data.
Practice types of data questions
1. Farah found some data on rainfall, in millimetres, in Australia over the last 30 years from a website.
Which option best describes the type of data she found?
Secondary and qualitative

Secondary, quantitative and continuous

Primary, quantitative and continuous

Secondary, quantitative and discrete

She did not collect the data herself and the data is a measurement.
2. Simon did an experiment measuring the length of a spring based on the force applied to stretch it.
Which option best describes the type of data he collected?
Secondary and qualitative

Secondary, quantitative and continuous

Primary, quantitative and continuous

Primary, quantitative and discrete

He collected the data himself and the data is a measurement.
3. Alice conducted a survey in her class to find the month her classmates were born.
Which option best describes the type of data she found?
Primary and qualitative

Secondary and qualitative

Primary, quantitative and continuous

Primary, quantitative and discrete

She collected the data herself and the data is non-numerical.
4. Which of the following diagrams would be a suitable option to display qualitative data.
Scatter graph

Frequency polygon

Pie chart

Stem and leaf diagram

The data is non-numerical, the other diagrams can only be used with numerical data.
5. Which option best describes the data shown on the frequency table.
Qualitative

Quantitative and continuous

Quantitative and discrete

Secondary

The data is numerical and a measurement.
6. What option best describes the data shown in the pictogram?
Primary

Quantitative and continuous

Quantitative and discrete

Qualitative

The data is non-numerical.
Types of data GCSE questions
1. The PE staff of a school were recording the times and distances in running and throwing events at the school sports day. Which of the following best describes the type of data collected. Tick all relevant boxes
Primary ☐
Secondary ☐
Qualitative ☐
Continuous ☐
(2 marks)
Primary
(1)
Continuous
(1)
2. Choose the option which best describes the data shown in the pie chart.
Discrete Qualitative Secondary Continuous
(1 mark)
Qualitative
(1)
3. Darren is researching the average shoe size in different parts of the world. He finds a few websites with the data he requires.
Choose the option which describes the data he will be collecting.
Primary and discrete Secondary and qualitative
Secondary and discrete Primary and continuous
(1 mark)
Secondary and discrete
(1)
Learning checklist
You have now learned how to:
- Interpret and distinguish between primary, secondary, qualitative, quantitative, discrete and continuous data
The next lessons are
Still stuck?
Prepare your KS4 students for maths GCSEs success with Third Space Learning. Weekly online one to one GCSE maths revision lessons delivered by expert maths tutors.

Find out more about our GCSE maths tuition programme.