GCSE Tutoring Programme
"Our chosen students improved 1.19 of a grade on average - 0.45 more than those who didn't have the tutoring."
In order to access this I need to be confident with:
Place value Ratio scale How to work out ratio Enlargement Metric units of measurementThis topic is relevant for:

Scale Maths
Here we will learn about scale maths, including scale diagrams and scale drawing, scale factors and real life applications.
There are also scale maths worksheets based on Edexcel, AQA and OCR exam questions, along with further guidance on where to go next if you’re still stuck.
What is scale maths?
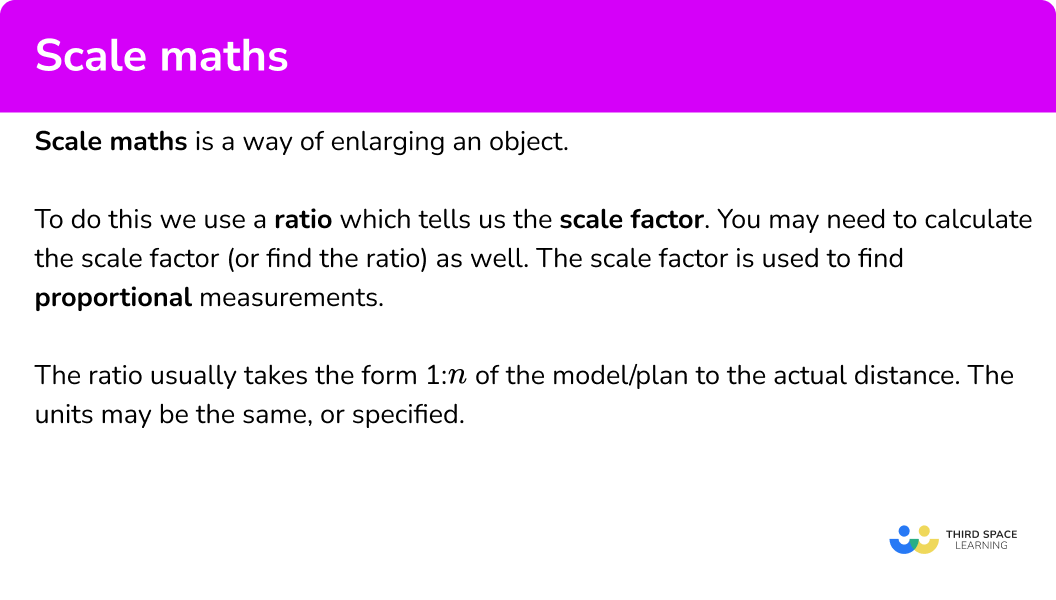
Scale maths is a way of enlarging an object.
If we have two shapes that are similar, one will be a scale diagram of the other.
We can calculate the scale factors for length, area and volume.
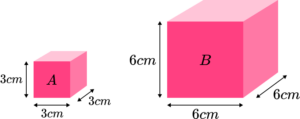
Let’s look at this example,
- Length scale factor
The length scale factor can be calculated by comparing two lengths.
We can compare the length of A with the length of B.

This gives the ratio 3:6 which simplifies to 1:2.
The length scale factor from A to B is \bf{2} .
- Area scale factor
The area scale factor can be calculated by comparing two areas.
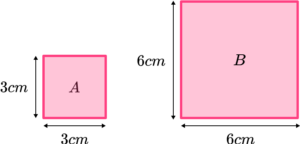
We can compare the area of A with the area of B.
Area A = 3cm \times 3cm = 9cm^{2}
Area B = 6cm \times 6cm = 36cm^{2}
This gives the ratio 9:36 which simplifies to 1:4.
The area scale factor from A to B is \bf{4} .
- Volume scale factor
The volume scale factor can be calculated by comparing two volumes.
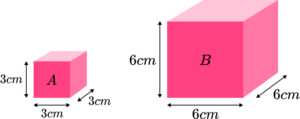
Volume A = 3cm \times 3cm \times 3cm = 27cm^{2}
Volume B = 6cm \times 6cm \times 6cm = 216cm^{2}
This gives the ratio 27:216 which simplifies to 1:8.
The volume scale factor from A to B is \bf{4} .
- Alternatively we can calculate the area and volume scale factors by starting with the scale factor for length.
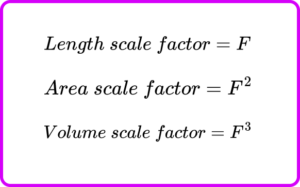
We can square the length scale factor to calculate the area scale factor.
We can cube the length scale factor to calculate the volume scale factor.
In the above example,
Scale factor for length = \bf{2}
Scale factor for area = 2^2 = \bf{4}
Scale factor for volume = 2^3 = \bf{8}
Step-by-step guide: Scale diagram
What is scale maths?
Scale drawing
Scale maths is used for real world scale drawings as it is much easier to create a scale drawing of an object, than to draw the object using actual distances.
The ratio usually takes the form 1:n of the model/plan to the actual distance.
For example,
Below is a scale diagram of a floor plan of a house where 1 square is equal to 2 metres.
Writing this as a ratio we get \bf{1} square: \bf{2 m.}
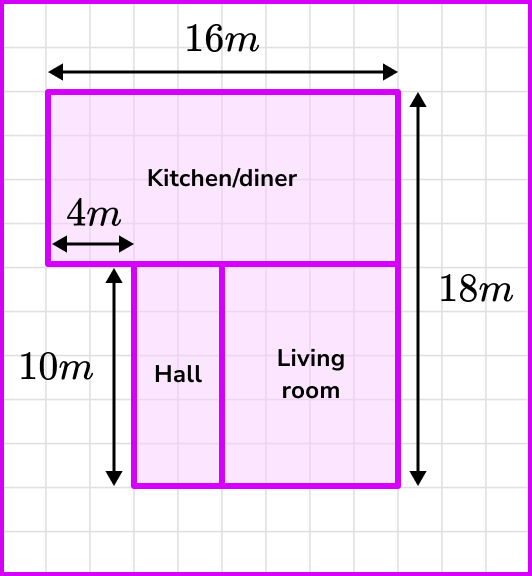
From this diagram, we can calculate the width of the living room by counting squares.
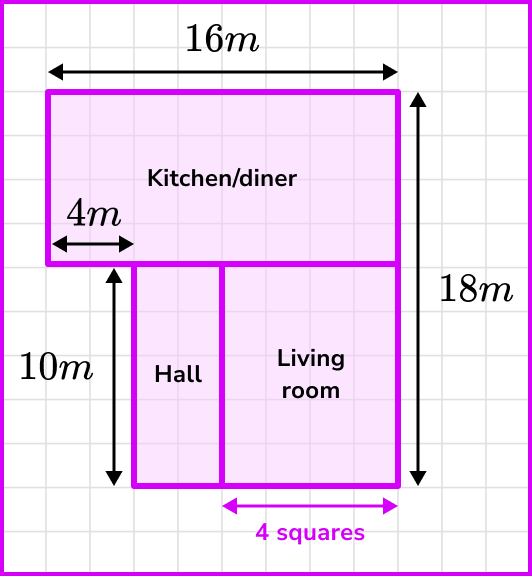
As the living room is 4 squares wide and we have the ratio 1 square: 2m, multiplying the number of squares by 2 we get the actual width of the living room.
4 \times 2=8m so the living room is 8m wide.
Step-by-step guide: Scale drawing
How to use scale maths
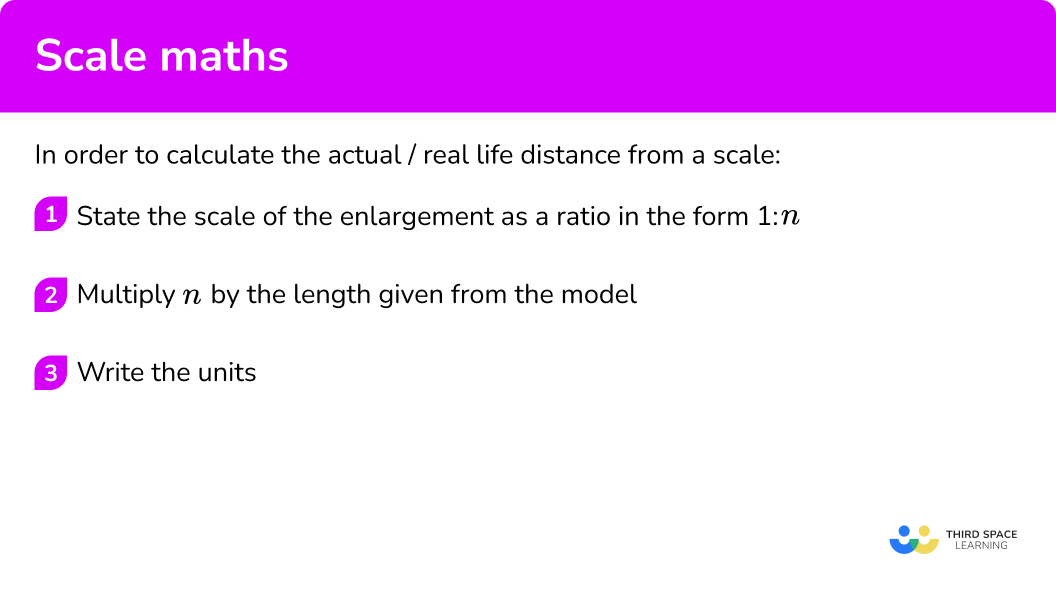
In order to calculate the actual / real life distance from a scale:
- State the scale of the enlargement as a ratio in the form \bf{1:n.}
- Multiply \bf{n} by the length given from the model.
- Write the units.
In order to calculate the model length from a scale:
- Divide the real life distance by the map scale ratio.
- Write the units.
In order to calculate a ratio from a scale diagram:
- Identify two lines that are mathematically similar.
- Express the lengths as a ratio \bf{A:B.}
- Simplify the ratio.
Explain how to use scale maths
Explain how to calculate the model length from a scale
Explain how to calculate a ratio from a scale diagram

Scale maths worksheet

Get your free scale maths worksheet of 20+ questions and answers. Includes reasoning and applied questions.
DOWNLOAD FREE
Scale maths worksheet

Get your free scale maths worksheet of 20+ questions and answers. Includes reasoning and applied questions.
DOWNLOAD FREEScale maths examples
Example 1: map (find the actual distance)
A map has a scale of 1cm:5km. Find the actual distance represented by 3cm on the map.
- State the scale of the enlargement as a ratio in the form \bf{1:n.}
2Multiply \bf{n} by the length given from the model.
5 \times 3=153Write the units.
15km.Example 2: plan of a structure (find the actual distance)
The construction plans for a structure has the scale 2cm:3m. What is the actual distance of 62cm on the plan?
State the scale of the enlargement as a ratio in the form \bf{1:n.}
We have the ratio 2cm:3m which we can express as the ratio 1cm:1.5m or in centimetres, 1cm:150cm.
Multiply \bf{n} by the length given from the model.
Write the units.
Example 3: map of the UK (find the model length)
A map of the UK is drawn using the scale 30cm:1500km. Calculate how far 480km would be on the map.
Divide the real life distance by the map scale ratio.
Before we do this, let’s convert the ratio to the form 1 \ cm:n \ km by dividing both sides of the ratio by 30.
1cm:50km
Now we can calculate the length on the map.
480 \div 50=9.6
Write the units.
Example 4: floor plan (find the model length)
A plan of a kitchen uses the scale 5cm:20cm. Calculate the distance on the plan for the actual distance of 8.7m.
Divide the real life distance by the map scale ratio.
Before we do this, let’s convert the ratio to the form 1 \ cm:n \ cm by dividing both sides of the ratio by 5.
1cm:4cm
We also can convert 8.7m to centimetres by multiplying it by 100 .
8.7m=870cm
870 \div 4=217.5
Write the units.
Example 5: 2D polygon (calculate the ratio)
A kite has a vertical height of 28cm and a width of 12cm. The scale diagram of the same kite has a width of 8cm.
What is the ratio of the real kite to the scale diagram? Write your answer in its simplest form.
Identify two lines that are mathematically similar.
Here we have the two widths of the kite with the lengths 12cm and 8cm.
Express the lengths as a ratio \bf{A:B.}
The ratio is of the form actual : scale diagram so we have the ratio
12 \ cm:8 \ cm .
Simplify the ratio.
Writing the ratio in the simplest form (divide throughout by 4 ) we have
3cm:2cm or 3:2 .
Example 6: scale model
The circumference of Jupiter is 439,624 \ km. A scale model of the planet has a diameter of 11.2 \ cm. Calculate the ratio of the scale diagram to the real planet Jupiter.
Give your answer if the form a \ cm:b \ km. Write a and b correct to 2 significant figures.
Identify two lines that are mathematically similar.
The circumference of a circle = \pi \times diameter and so the circumference of the scale diagram of Jupiter is
C= \pi \times 11.2=35.185... cm.
We can now use the two circumferences 35.185...cm and 439624 \ km.
Express the lengths as a ratio \bf{A:B.}
The ratio is of the form scale diagram : actual so we have the ratio
35.185...cm:439624 \ km .
Simplify the ratio.
This ratio cannot be simplified but we could round the values to make them easier to read. Rounding the ratio, we get
35 \ cm:440 \ 000 \ km .
Common misconceptions
- Multiplying the real life distance by the ratio scale
A common error is to multiply the real life distance by the ratio scale instead of dividing, giving an incorrect distance on the plan.
- Dividing the model / plan / map distance by the ratio scale
A common misconception is to divide the distance on the model / plan / map by the ratio scale resulting in an incorrect real life distance.
- The order of the ratio is incorrect
Stating the ratio in the incorrect order will mean that the scale diagram is much larger / smaller than expected.
For example, a ratio represents the scale diagram to the real life distance. The ratio 1:2 means that the real life distance is twice the length of the scale diagram. The ratio 2:1 on the other hand means that the real life distance is half of the scale diagram.
- Ratio scale not simplified
If given the ratio 2 \ cm:5 \ km, it is easier to calculate when the ratio is in the form 1:n and so we must find an equivalent ratio before using the scale.
Here the ratio would be 1 \ cm:2.5 \ km so 1 \ cm on the map would be equal to 2.5 \ km in real life
- Incorrect units in the solution
A common misconception is to mix up the units for the model with the units for the real life distance.
For example, if we were calculating the distance of 10 \ cm on a map with the scale ratio of 1 \ cm:5 \ km, \ 10 \times 5=50 \ cm could be incorrectly stated. Whereas the correct solution would be 10 \times 5=50 \ km.
- Converting units
Sometimes the units need to be converted, so it is important to be able to confidently convert between different metric units.
For example, the map scale is given as 1:25 \ 000 which means that 1 \ cm on the map is equivalent to 25 \ 000 \ cm in real life. If the answer need to be be written in kilometres, the real life value in centimetres must be divided by 100 \ 000 to get the same measurement in kilometres. 1:25 \ 000=1 \ cm:0.25 \ km.
Practice scale maths questions
1. A map has a scale 1:125 \ 000. The distance between two points on the map is 3.8 \ cm. What is the real distance in kilometres?


2. The plan of a window seat is drawn using the scale of 2 \ cm:1 \ m. What is the actual length of the window seat if it measures 5.8 \ cm on the scale drawing?


3. A map has a scale of 1 \ cm:2 \ km. The length of a walk is measured as 13850 \ m. What would the distance on the map be for the same walk? Give your answer correct to 1 decimal place.


This rounds to 6.9 \ cm.
4. A plan of a cruise ship uses the scale 1 \ cm:0.8 \ m. The deck of the ship is 304 \ m in length. Calculate the length of the model cruise ship in metres.


5. Below is a diagram showing two triangular prisms. Prism B is a model of Prism A.
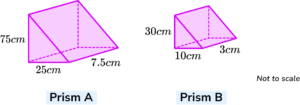
Calculate the ratio of lengths of Prism A to lengths of Prism B in its simplest form.


Taking one similar length (the height for example) from each prism,
75:30=5:2 .
6. The length of a table is 3.9 \ m; the length of the table is 3 times its width. The width of the table on the diagram is 20 \ cm.
Calculate the ratio of the length of real table to the length of the diagram table. Give your answer in the form n:m where n and m are integers.


Scale maths GCSE questions
1. A map has a scale of 1 \ cm represents 60 \ m.
(a) Write this scale as a ratio in its simplest form.
The distance between two shops on the map is 3.8 \ cm.
(b) What is the actual distance between the shops?
(4 marks)
(a)
60 \ m=60 \times 100=6000 \ cm
(1)
1:6000(1)
(a)
3.8 \times 60
(1)
=228 \ m(1)
2. (a) A car wheel has a diameter of 44 \ cm. A model car wheel has a radius of 2.75 \ cm.
Calculate the scale ratio of the model to the real life car. Write your answer in its simplest form.
(b) The height of the car is 1.3 metres. Calculate the height of the model car in centimetres.
(5 marks)
(a)
2.75 \times 2=5.5
(1)
5.5:44(1)
1:8(1)
(b)
1.3 \div 8=0.1625
(1)
0.1625 \times 100=16.25 \ cm(1)
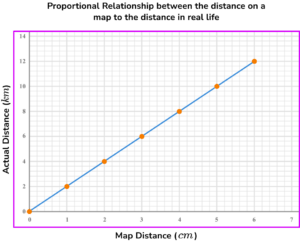
3. Use the graph below to determine the scale of a map in the simplest form. Express both values in the scale in centimetres.
(3 marks)
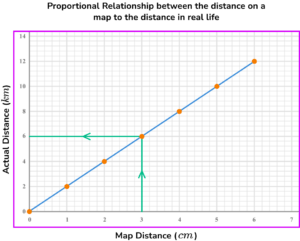
Obtain one pair of values from the graph; here 3 \ cm=6 \ km
(1)
1 \ cm:2 \ km(1)
1:200 \ 000(1)
Learning checklist
You have now learned how to:
- Use scale factors, scale diagrams and maps
- Consolidate their understanding of ratio when comparing quantities, sizes and scale drawings by solving a variety of problems
- Multiplying and dividing by powers of 10 in scale drawings or by multiplying and dividing by powers of a 1,000 in converting between units such as kilometres and metres
- Solve problems involving similar shapes where the scale factor is known or can be found
The next lessons are
Still stuck?
Prepare your KS4 students for maths GCSEs success with Third Space Learning. Weekly online one to one GCSE maths revision lessons delivered by expert maths tutors.

Find out more about our GCSE maths tuition programme.