GCSE Tutoring Programme
"Our chosen students improved 1.19 of a grade on average - 0.45 more than those who didn't have the tutoring."
In order to access this I need to be confident with:
Constructing Venn diagrams Venn diagram symbols Forming and solving equationsThis topic is relevant for:

Venn Diagram Union And Intersection
Here we will learn about Venn diagram union and intersection, including calculating the union of two or more sets, calculating the intersection of two or more sets, and finding unknown values using the union and intersection.
There are also Venn diagram union and intersection worksheets based on Edexcel, AQA and OCR exam questions, along with further guidance on where to go next if you’re still stuck.
What are Venn diagram union and intersection?
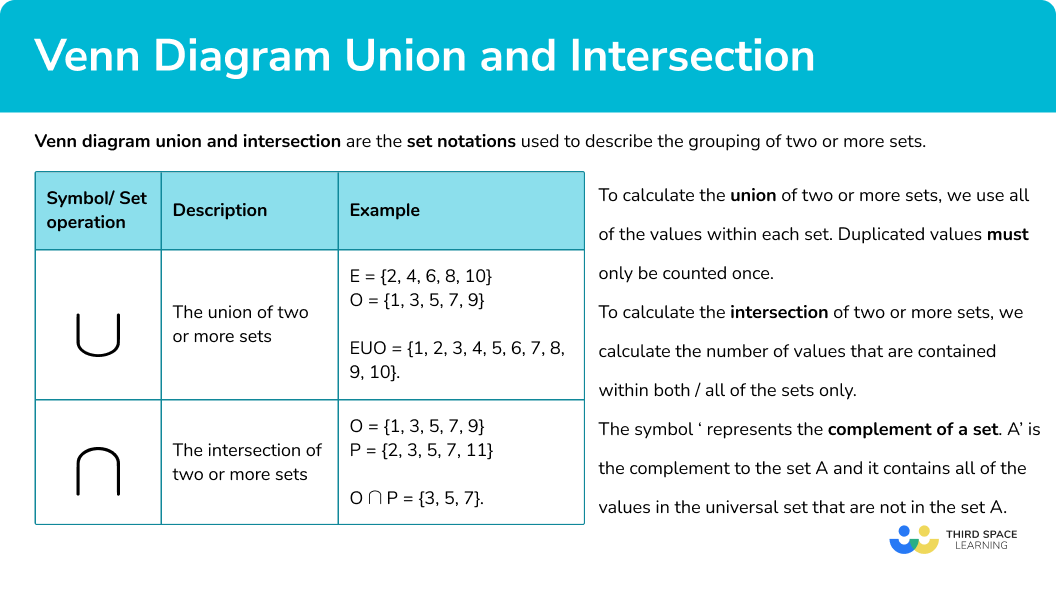
Venn diagram union and intersection are the set notations used to describe set relationships.
- The union of the set of even numbers E ={2, 4, 6, 8, 10} and odd numbers O ={1, 3, 5, 7, 9} is the set E\cup O ={1, 2, 3, 4, 5, 6, 7, 8, 9, 10}.
The symbol \cup represents the union of sets.
For the two sets A and B , A\cup B is pronounced A union B .
To calculate the union of two or more sets, we combine the elements within each set. Duplicated values must only be counted once.
- The intersection of the set of odd numbers O ={1, 3, 5, 7, 9} and the set of prime numbers P ={2, 3, 5, 7, 11} is the set O\cap P ={3, 5, 7}.
The symbol ∩ represents the intersection of sets.
For the two sets A and B , A\cap B is pronounced A intersection B .
To calculate the intersection of two or more sets, we calculate the number of values that are contained within both / all of the sets only.
The complement of a set (or the absolute complement of a set) is the values that are not contained in the set.
For example,
The complement of the set of positive numbers is the set of negative numbers and 0 (as 0 is neither positive or negative).
The symbol ‘ represents the complement of a set.
A’ is the complement to the set A and is known as a disjoint set because an item in the set A cannot also be in the set A’.
What are Venn diagram union and intersection?
How to calculate the union of two sets
In order to calculate the union of two sets:
- Calculate the frequencies in each subset of the Venn diagram.
- Add all of the frequencies within the two sets.
How to calculate the union of two sets

Venn diagram worksheet (includes Venn diagram union)

Get your free Venn diagram union worksheet of 20+ Venn diagram questions and answers. Includes reasoning and applied questions.
DOWNLOAD FREE
Venn diagram worksheet (includes Venn diagram union)

Get your free Venn diagram union worksheet of 20+ Venn diagram questions and answers. Includes reasoning and applied questions.
DOWNLOAD FREERelated lessons on Venn diagram symbols
Venn diagram union and intersection is part of our series of lessons to support revision on how to calculate probability. You may find it helpful to start with the main Venn diagram lesson for a summary of what to expect, or use the step by step guides below for further detail on individual topics. Other lessons in this series include:
Venn diagram union examples
Example 1: union of two sets
The Venn diagram below describes the classification of 37 animals classified into the two sets of A ={Vertebrates} and B ={\geq 4 legs}.
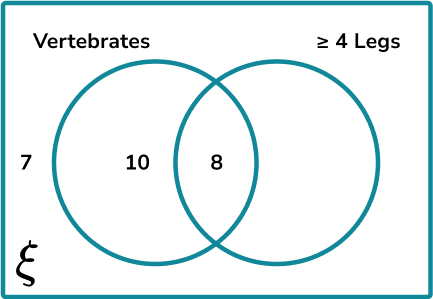
Calculate the frequency of values in the set A\cup B.
- Calculate the frequencies in each subset of the Venn diagram.
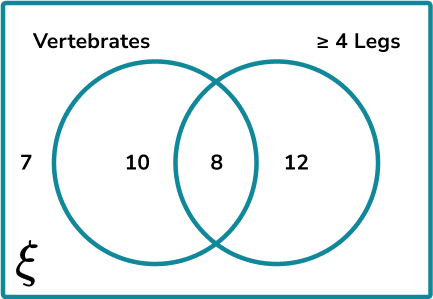
There are 37 animals in the universal set. Currently, we know the classification of 25 animals (7 + 10 + 8 = 25) . The frequency of the missing subset (invertebrates with 4 or more legs) is equal to 37 - 25 = 12 .
2Add all of the frequencies within the two sets.
10 + 8 + 12 = 30.30 animals are either vertebrates or have 4 or more legs, or both.
Example 2: union of three sets
28 students were asked about their favourite colour. Results were split into the three sets of primary colours R ={Red}, B ={Blue}, and Y ={Yellow}. 16 students chose Yellow, and 9 students chose a secondary colour.
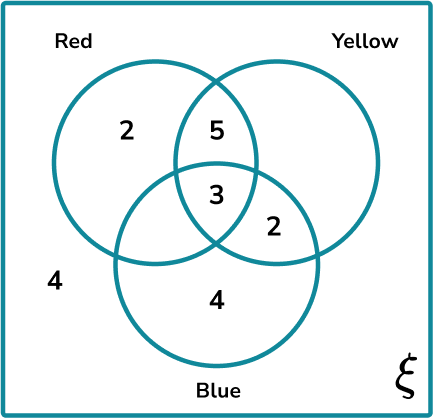
Calculate the frequency of B\cup Y.
Calculate the frequencies in each subset of the Venn diagram.
As 16 students chose yellow, we can calculate how many students chose just yellow as 16 - (5 + 3 + 2) = 6.
6 students chose yellow only.
As 9 students chose a secondary colour, with 5 choosing orange, and 2 choosing green, we need to find the frequency of students who chose purple, 9 - (5 + 2) = 2 .
We have the Venn diagram,
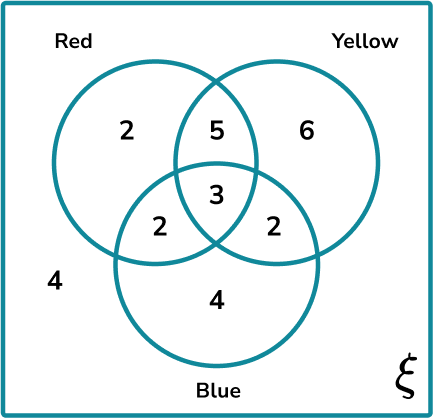
Add all of the frequencies within the two sets.
We want the total frequency of B\cup Y , so we need to add all of the subsets in the two sets.
5 + 6 + 3 + 2 + 2 + 4 = 22 B\cup Y = 22Example 3: union of two sets – algebraic
32 people were asked what roast dinner they prefer. The results were divided into two sets, C={Chicken}, or B ={Beef}.
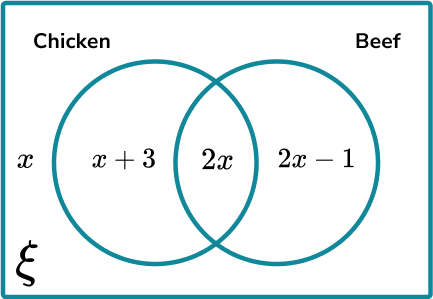
Given that 17 people chose only chicken or only beef, calculate how many people are in the set B\cup C.
Calculate the frequencies in each subset of the Venn diagram.
As we know 17 people chose only chicken or only beef, we can find the value of x by adding these two frequencies together from the Venn diagram, and solving the equation.
Substituting x=5 into each subset, we have
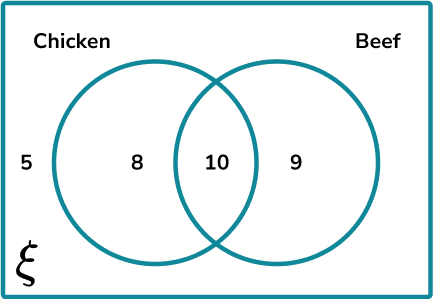
Add all of the frequencies within the two sets.
All of the frequencies in set B and C add to equal 8 + 10 + 9 = 27.
B \cup C= 27.How to calculate the intersection of two sets
In order to calculate the intersection of two sets:
- Calculate the frequencies in each subset of the Venn diagram.
- State the frequency within the overlapping circles.
How to calculate the intersection of two sets

Venn diagram intersection examples
Example 4: intersection of two sets
22 people at the cinema were asked about whether they had purchased P ={popcorn} and/or a F ={fizzy drink} before the film started. 15 people bought a fizzy drink, and 8 people only bought a fizzy drink. By completing the Venn diagram below, determine P\cap F.
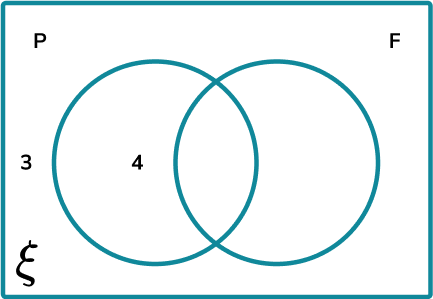
Calculate the frequencies in each subset of the Venn diagram.
As 15 people bought a fizzy drink, and 8 only bought a fizzy drink, we can calculate how many people bought popcorn and a fizzy drink by calculating
15 - 8 = 7 .
This gives us the Venn diagram,
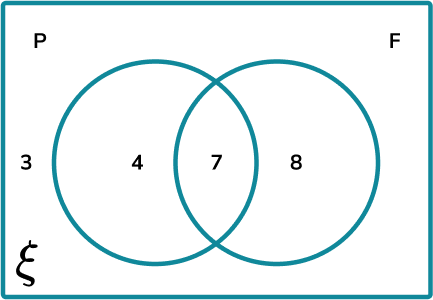
State the frequency within the overlapping circles.
Example 5: intersection of three sets
49 people were asked about their favourite sport(s) to watch on TV. The three sports were grouped into categories, F ={Football}, R ={Rugby}, and T ={Tennis}. Use the information below to complete the Venn diagram, and hence state the value of R\cap T.
- 7 people do not watch any sport on TV.
- 10 people watch Football and Tennis.
- 6 people watch Football and Rugby, but not Tennis.
- 5 people watch all 3 sports.
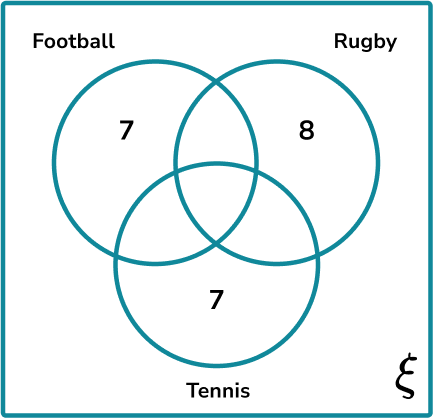
Calculate the frequencies in each subset of the Venn diagram.
As 7 people do not watch any sport, we can write 7 outside of the three circles but within the universal set.
5 people watch all 3 sports so the very centre (the intersection of all three circles) is 5 .
As 10 people watch Football and Tennis, and 5 people also watch Rugby, we can say that 5 people watch Football and Tennis only.
6 people are in the intersection of Football and Rugby only.
49 people were asked and so the remaining 4 people watch Rugby and Tennis only.
This gives us the completed Venn diagram.
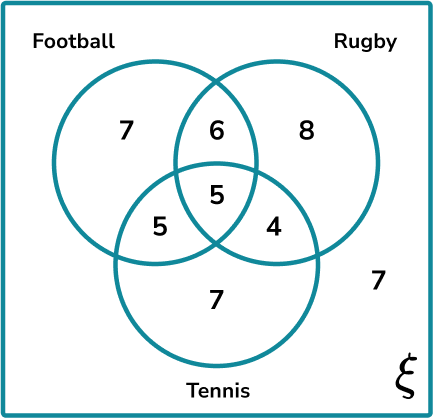
State the frequency within the overlapping circles.
R\cap T is the set of people who watch Rugby and Tennis. This also includes those who watch Rugby, Tennis, and Football as they still watch Rugby and Tennis. Adding the two subsets together, we get
5 + 4 = 9 R\cap T = 9.Example 6: intersection of two sets – algebraic
A group of people were asked about whether they owned a cat (Set C ) or a dog (set D ). The results are displayed in the two circle Venn diagram below.
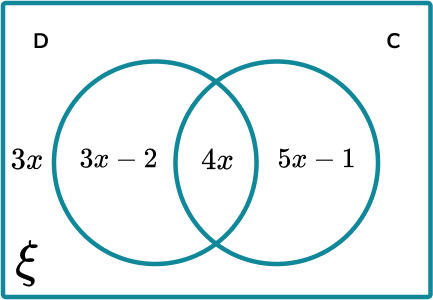
Given that 46 people do not own a cat, calculate the frequency of C\cap D’ .
Calculate the frequencies in each subset of the Venn diagram.
As 46 people do not own a cat, the subsets that are included are everything outside of the set C , which creates the equation
Substituting x=8 into each subset in the Venn diagram, we have
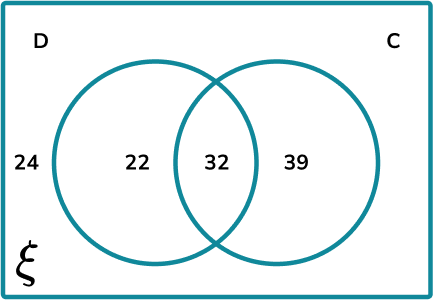
State the frequency within the overlapping circles.
We want the subset C\cap D ’ which is the set of people who own a cat, and do not own a dog. This could also be expressed as people who own a cat only.
C\cap D’ = 39.Common misconceptions
- Placing every item in a set in the intersection
The intersection is the overlap between set A and set B . If the item is only in Set A and not Set B , it must go in the subset that is just A , and not the intersection.
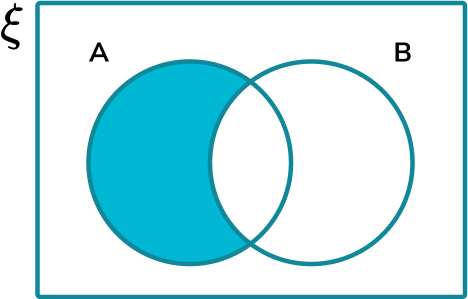
(This is the section A\cap B ‘ pronounced A and not B , or, just A )
Step-by-step guide: Venn diagram symbols
- Missing values
Make sure that every value within all of the sets is written into the Venn diagram.
- Incorrect set notation
Curly brackets {} contain all of the items within a set, separated by commas. You therefore write items within a set in curly brackets, a frequency is a whole number, and a probability is expressed as a fraction. Be careful what the question is asking as the wrong set notation can be used as a consequence of this misunderstanding.
- Frequencies or items
A Venn diagram may contain the items (lists of data values), frequencies (the number of elements in the set) or potentially probabilities (as fractions). You should be confident with all three types and not mix them up.
- No universal set
The universal set contains all of the items within every set given. If an item does not go in either circle, the item is written in the outer region, still within the rectangular universe.
- The empty set
It is possible that a set contains no items, or the empty set. The frequency should therefore be written as 0 , and not left blank.
Practice venn diagram union questions
1. The Venn diagram below shows the frequency of cars that belong to the two sets A ={Hatchback} and B ={Blue}.
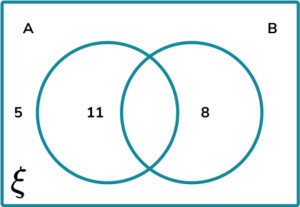
Given that 14 cars were blue, calculate the frequency of cars in the set A\cup B .


As 14 cars were blue, the number of cars that were Blue and a hatchback is 14 – 8 = 6 . This goes into the overlap of the two circles ( A\cap B ).
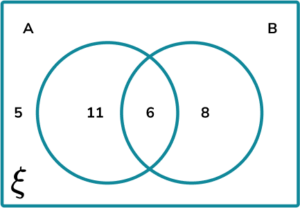
A\cup B = 11 + 6 + 8 = 25
2. A group of students were asked about whether they like Maths ( M ), English ( E ) or Science ( S ). Below is a Venn diagram of the results.
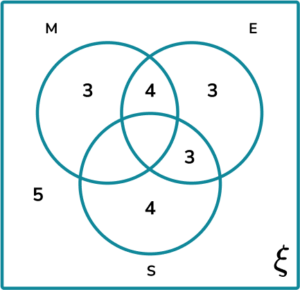
Given that 14 students like Maths, and 12 students like English, calculate the frequency of students in the set E\cup S .


As 12 students like English, the intersection of all three circles ( M\cap E\cap S ) = 12 – 10 = 2.
As 14 students like Maths, the intersection of students who like Maths and Science, but not English ( M\cap S\cap E’ ) = 14-9 = 5.
The Venn diagram now looks like this,
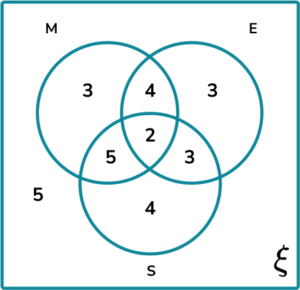
E\cup S = 4 + 5 + 2 + 3 + 4 + 3 = 21
3. A gardener is analysing the holly plants in the local woodland. He groups them into two categories
- B ={has berries}
- S ={has spiky leaves}
The Venn diagram of the gardener’s findings is given below.
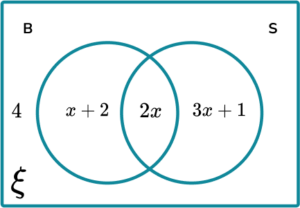
Given that the frequency of plants ξ = 25 , determine the frequency for B\cup S.


As the frequency of plants ξ = 25 , forming an equation, we have
4+x+2+2x+3x+1=25\\ 6x+7=25\\ 6x=18\\ x=3
Substituting x=3 into each subset in the Venn diagram, we have
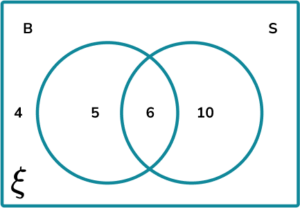
B\cup S = 5 + 6 + 10 = 21
4. The weather forecast was recorded every hour for one day. The results were collated into a Venn diagram using the two sets R ={Rain} and W ={Wind}.
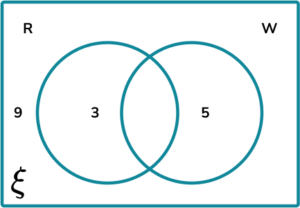
Calculate the frequency of R\cap W.


As there are 24 hours in one day, if we subtract the frequency of the other sets, we will calculate R\cap W .
24 – (9 + 3 + 5) = 24 – 17 = 7
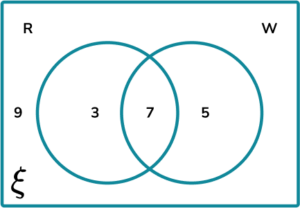
R\cap W = 7.
5. A music theatre invites the staff to participate in a research study. They asked each member of staff which of the three subjects A ={Art}, D ={Drama} or M ={Music} they studied at GCSE. The results are displayed in the Venn diagram below.
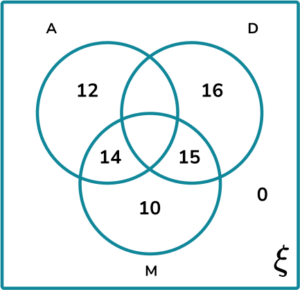
Given that D ={ 59 }, and A\cap D\cap M ’ = M\cap (A\cup D) ’ determine the frequency of people in the set A\cap D .


As we know the value for A\cap D\cap M’ = M\cap (A\cup D) ’, we know that the set A\cap D\cap M ’ has a frequency of 10 .
As 59 people studied Drama, we have
A\cap D\cap M = 59 – (10 + 15 + 16) = 18 .
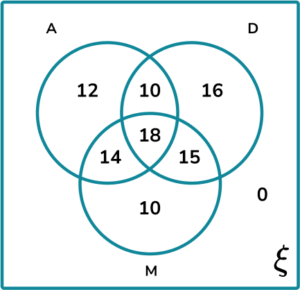
A\cap D = 10 + 18 = 28.
6. A bird watcher recorded the days in which he saw B ={Blackbirds} and S ={Sparrows} in his garden. The frequencies were recorded in a Venn diagram.
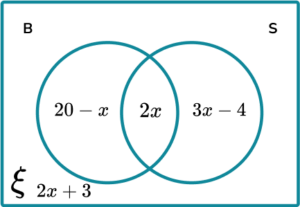
Given that ( B\cap S)’ = 67 , calculate the frequency of ξ.


As ( B\cap S)’ = 67 ,
20-x+2x+3+3x-4=67\\ 4x+19=67\\ 4x=48\\ x=12
Substituting x=12 into each subset of the Venn diagram, we have
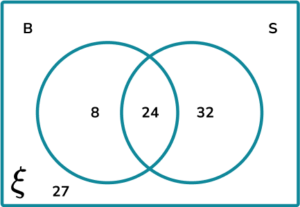
ξ = 8 + 24 + 32 + 27 = 91.
Venn diagram union GCSE questions
1. Which notation correctly describes the shaded region for the following Venn diagram,
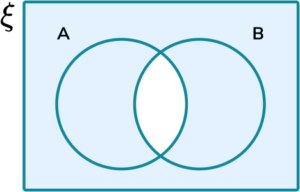
(1 mark)
(1)
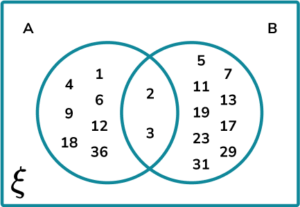
2. (a) Draw a Venn diagram for the two sets,
- A ={Factors of 36 }
- B ={Prime numbers up to 36 }
(b) Describe the set A\cap B ’.
(c) State the frequency of numbers in the set ( A\cap B )’.
(4 marks)
(a)
All correct values in both sets.
(2)
(b)
The factors of 36 that are not prime numbers.
(1)
(c)
16(1)
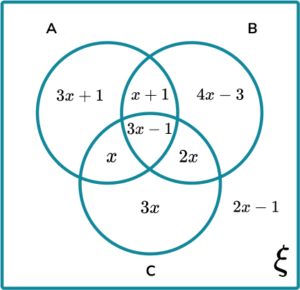
3. Given that A\cup (B\cup C)’ = 20 for the Venn diagram below, calculate the frequency of values in the set B\cap C.
(5 marks)
(1)
10x=20(1)
x=2(1)
B\cap C = 3x-1+2x(1)
B\cap C = 9(1)
Learning checklist
You have now learned how to:
- Enumerate sets and unions/intersections of sets systematically, using tables, grids and Venn diagrams
The next lessons are
Still stuck?
Prepare your KS4 students for maths GCSEs success with Third Space Learning. Weekly online one to one GCSE maths revision lessons delivered by expert maths tutors.

Find out more about our GCSE maths tuition programme.